Market
Sales, prices and stock of this model on the market
This section analyzes the market of the model of the vehicle over the last months: how many units are sold, at what price, how long they take to sell and whether demand exceeds supply.
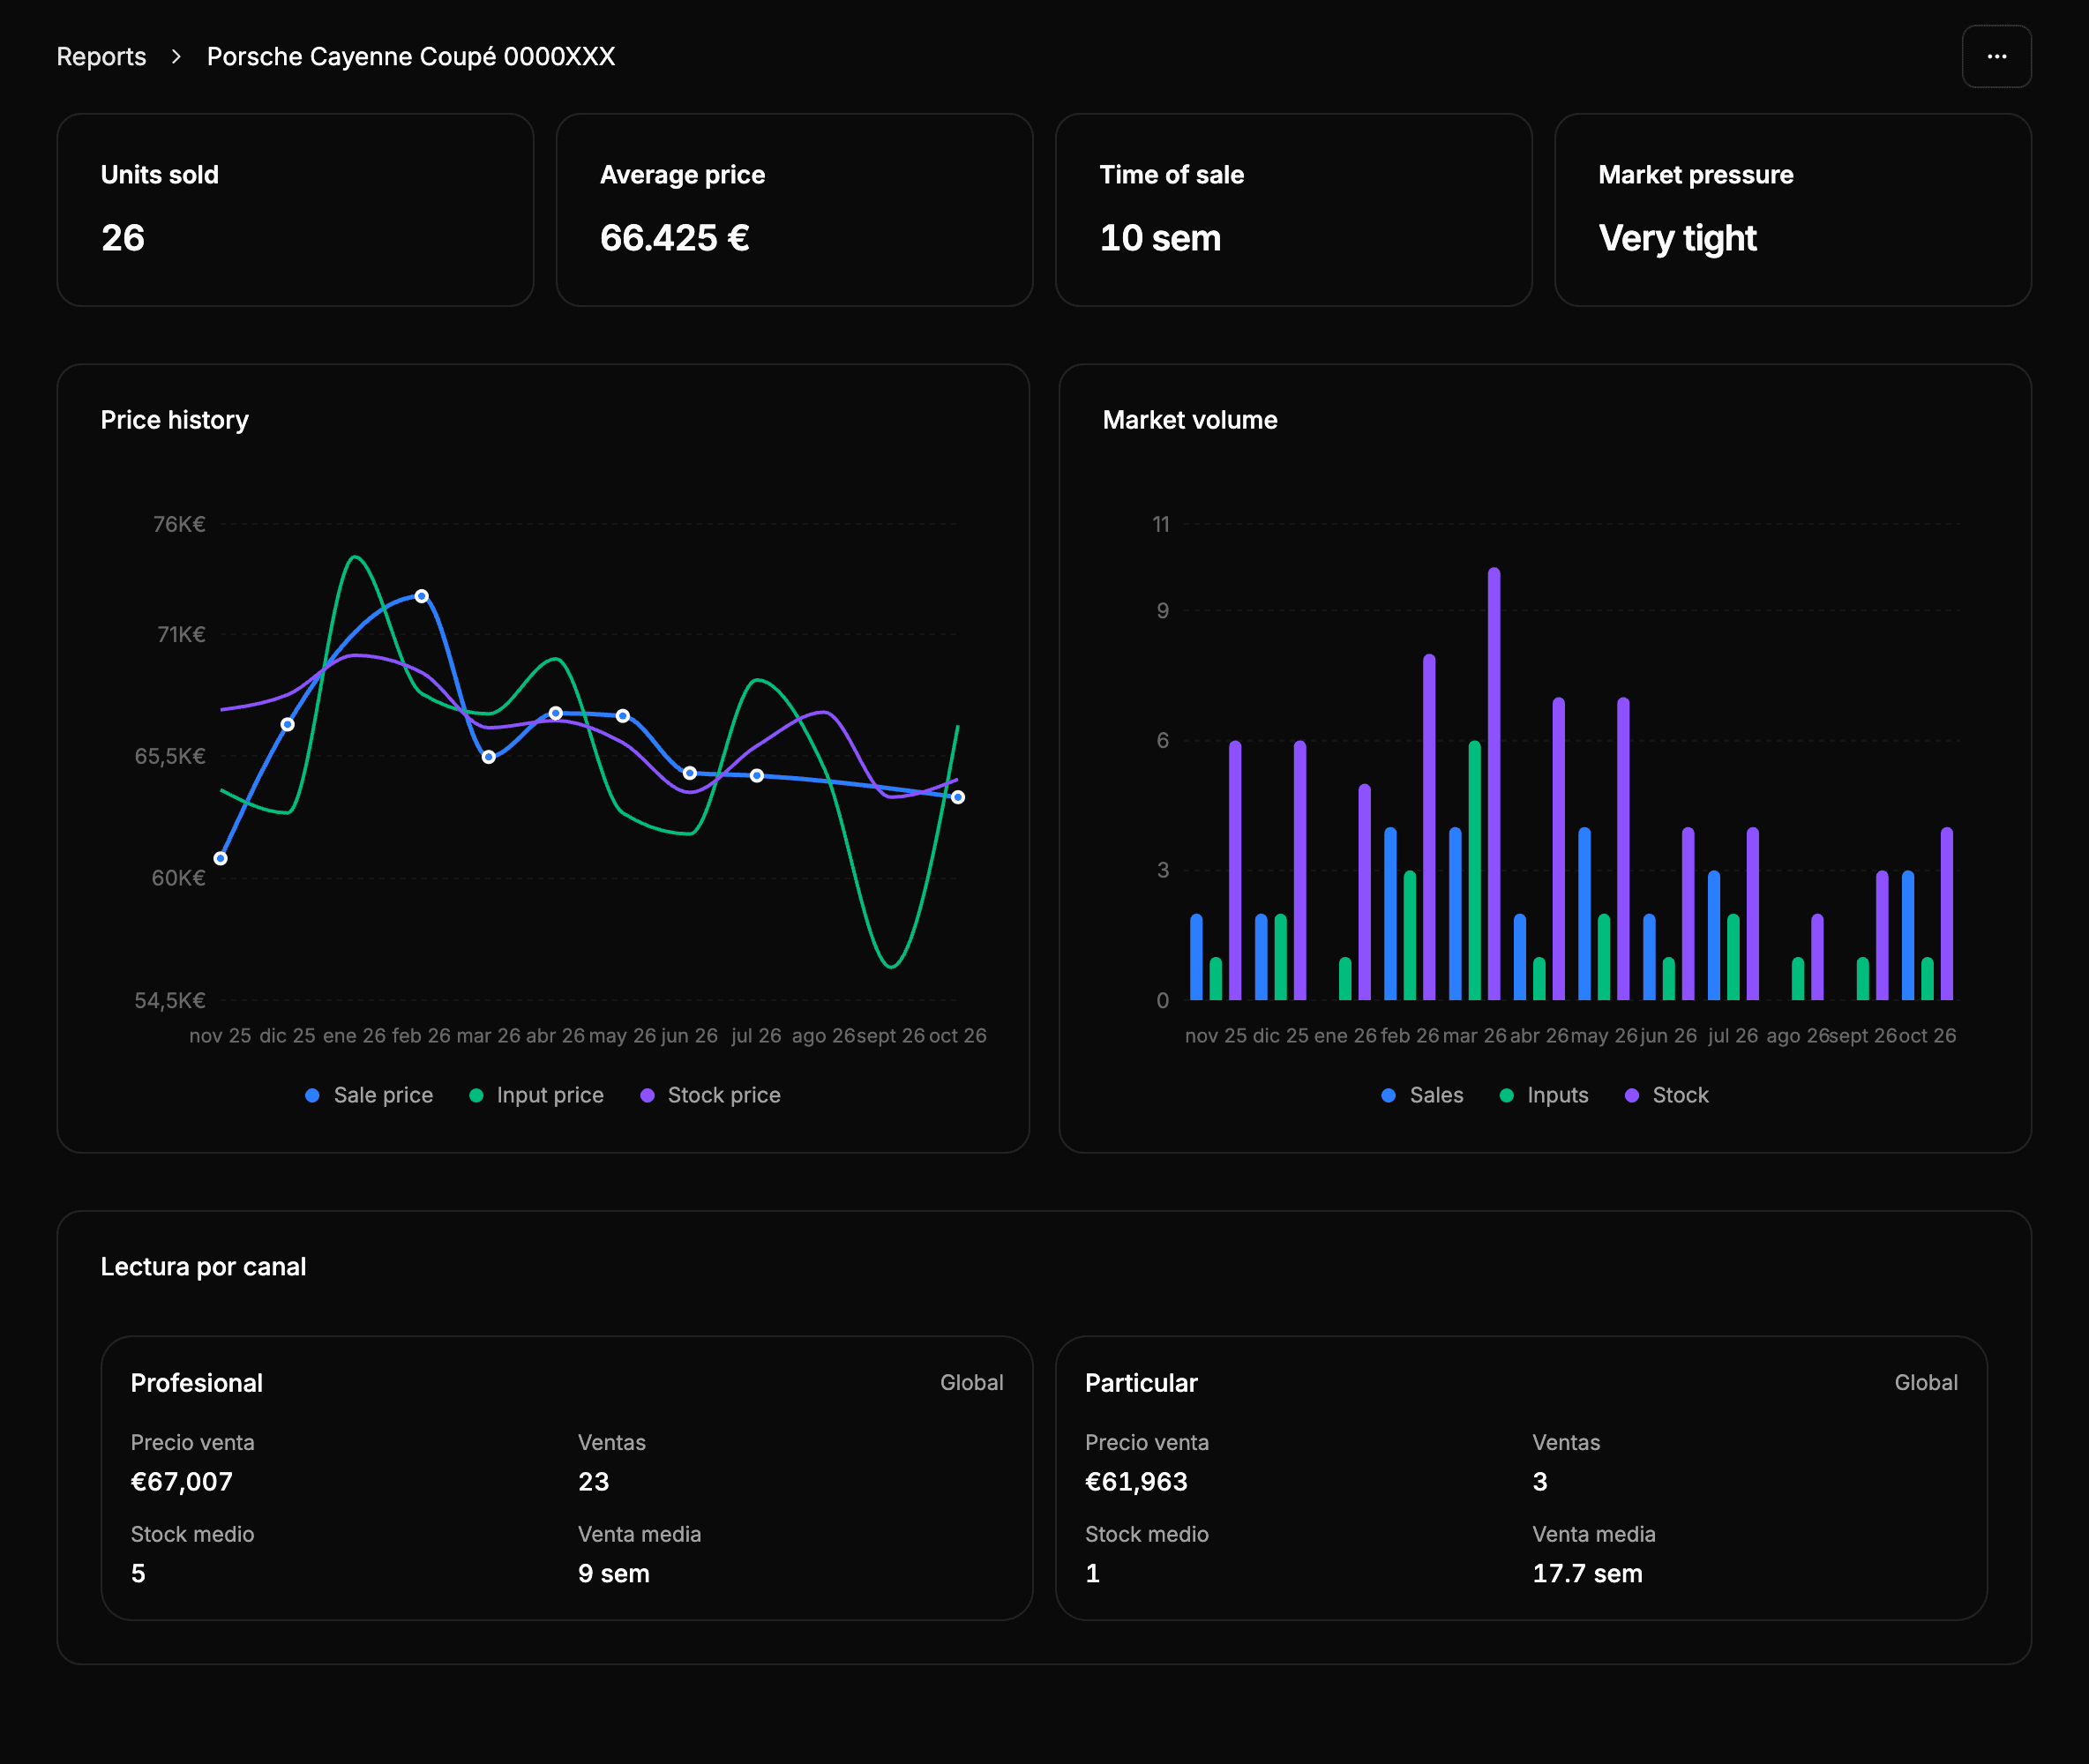
Summary
The indicators summarize the last 12 months:
| Indicator | What it shows |
|---|---|
| Units sold | How many units of the model have been sold. |
| Average price | The average sale price, weighted by the units sold each month. |
| Time of sale | How many weeks a unit takes to sell, on average. |
| Market pressure | The balance between sales and new units for sale. |
The market pressure compares the units sold with the units that come onto the market:
| Market pressure | Meaning |
|---|---|
| Very tight | Many more sales than new units: demand clearly exceeds supply. |
| Tight | More sales than new units. |
| Balanced | Sales and new units are similar. |
| Loose | Fewer sales than new units. |
| Very loose | Many fewer sales than new units: supply clearly exceeds demand. |
In a tight market the vehicles of this model sell easily and hold their price better; in a loose one, they take longer to sell and the prices tend to fall.
Price history
The monthly evolution of three prices: the sale price (of the units sold), the input price (of the units that come onto the market) and the stock price (of the units for sale).
Market volume
The monthly units of sales, inputs (units that come onto the market) and stock (units for sale).
By channel
The same indicators separated by seller type, professional and private: sale price, sales, average stock and average time of sale. Dealers and private sellers usually work at different price levels.
How to use it
- To set a price: compare the asking price with the average sale price and with the valuation.
- To know how fast it will sell: check the time of sale and the market pressure.
- To choose a channel: compare the prices and times of professionals and private sellers.