Mileage
The odometer readings of the vehicle and how it has been used
This section reconstructs the mileage history of the vehicle from its official readings. It tells you how many kilometers it has, how it has been used and whether its odometer has evolved consistently.
Where the readings come from
The readings come from the technical inspections of the vehicle, which record its odometer. The registration date counts as a first reading at 0 km. When there are several readings in the same year, the highest one is used.
Summary
The four indicators at the top give a quick overview of the mileage of the vehicle: how many kilometers it has, how many it covers per year, when it was last read and how it has been used most of the time.

| Indicator | What it shows |
|---|---|
| Mileage | The latest reading of the odometer. |
| Annual average | The kilometers driven per year, on average. |
| Latest reading | The date of the latest reading. |
| Dominant pattern | The type of use the vehicle has had for the longest time. |
Usage classification
The time between two consecutive readings is a period. Each period is classified by its monthly pace of kilometers:
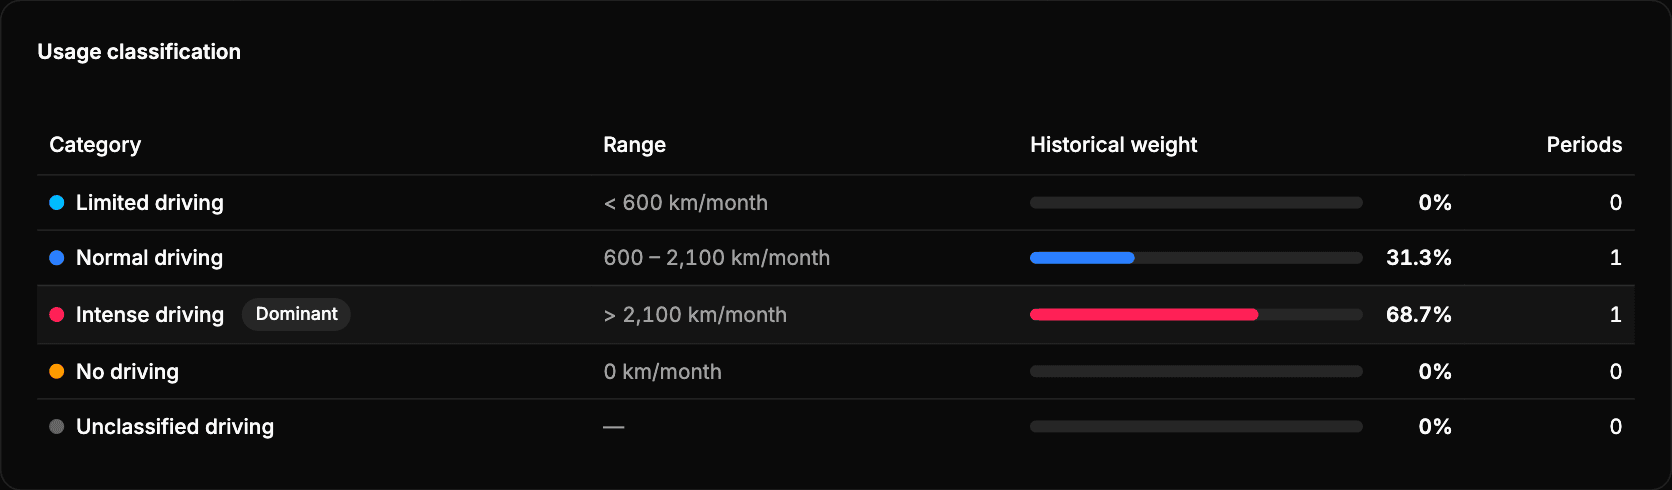
| Category | Pace | Interpretation |
|---|---|---|
| Limited driving | Less than 600 km/month | Lower than usual use: short trips, a second car or periods of low activity. |
| Normal driving | 600 to 2,100 km/month | Regular, balanced use. |
| Intense driving | More than 2,100 km/month | High use, which may mean more wear. |
| No driving | 0 km/month | The odometer does not advance: the vehicle was parked or deregistered. |
| Unclassified driving | — | The period cannot be classified: the mileage went down, the dates are not comparable or there is not enough data. |
The historical weight is the share of time of each category, and periods is how many periods it has. The dominant category is the one with the most time, not necessarily the one with the most periods.
Mileage evolution
The chart shows the odometer over the years:
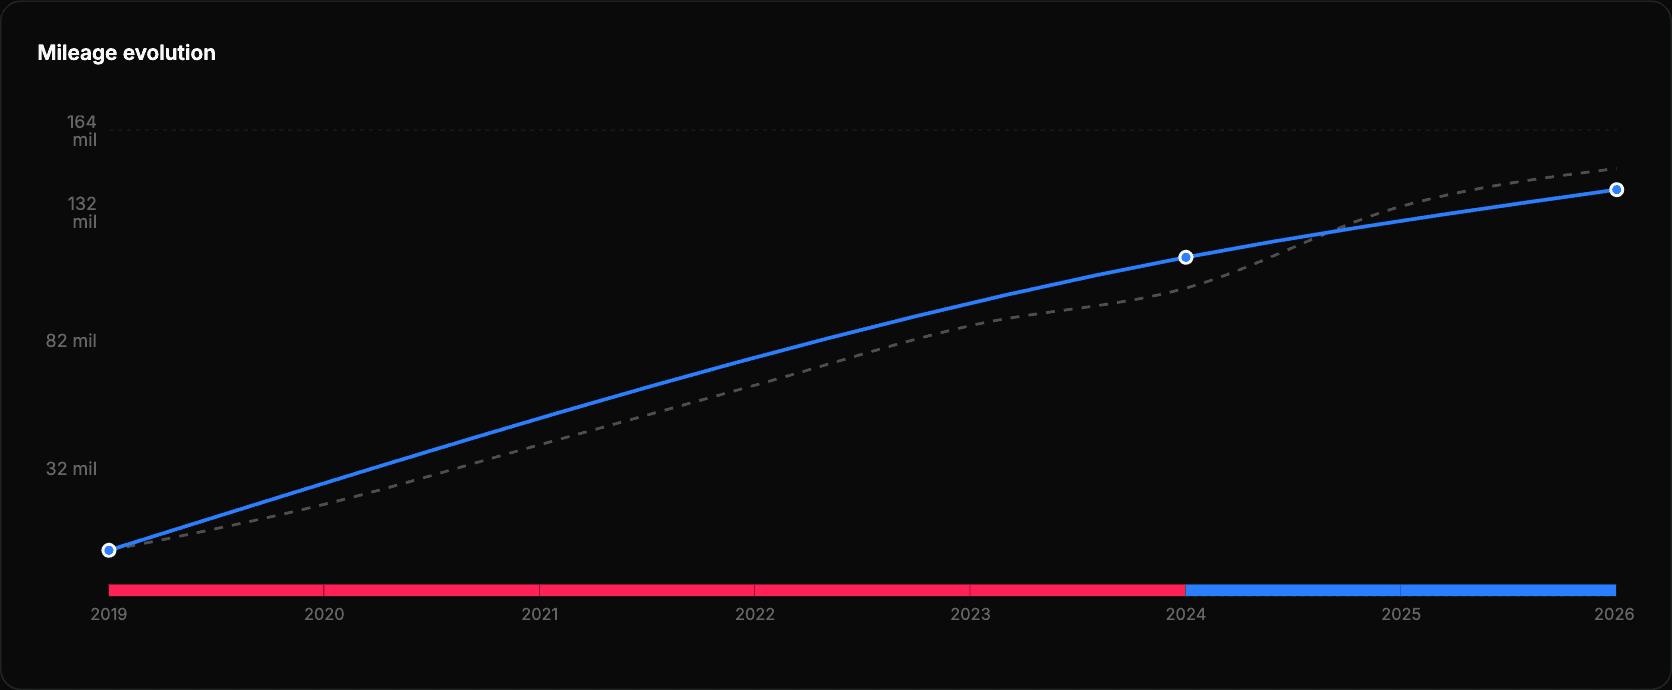
- Blue line: the real readings.
- Dashed gray line: the trend expected from all the readings of the vehicle.
- Colored bar: the usage category of each period, with the colors of the classification.
Hover over a reading to see its mileage, the mileage expected by the trend, the difference between both, the pace since the previous reading and the change in kilometers.
Readings
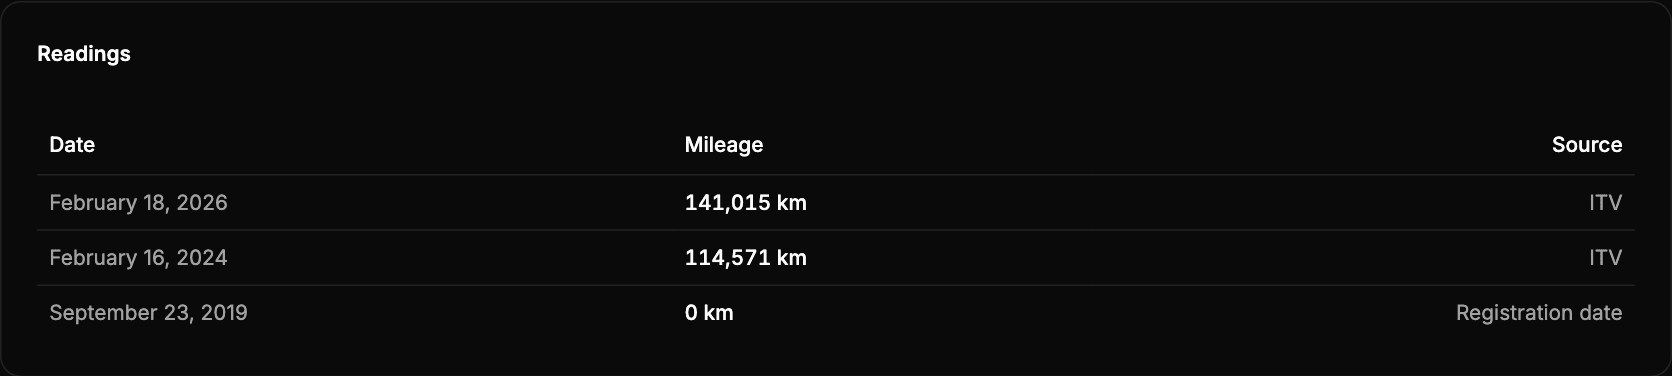
The list of readings, with their date, mileage and source (ITV or Registration date).
How to use it
- Look first at drops or abrupt jumps. A reading lower than a previous one may be a recording error or a manipulation of the odometer: the overview alerts you about it.
- Compare the real readings with the trend to spot unusual periods.
- Interpret intense driving together with the age and the maintenance of the vehicle.
The readings only show the odometer on the dates of the inspections: between two inspections the use may have been uneven.